 Evidence Balance Sheet
 Evidence Balance Sheet

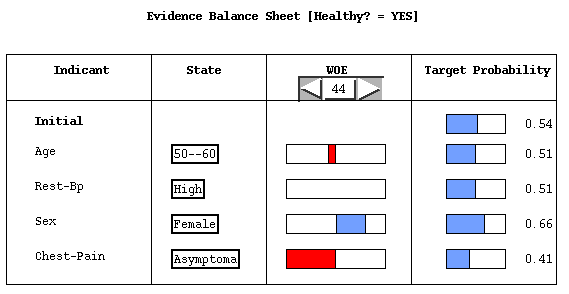
The evidence balance sheet (pictured above) shows the evidence for the target variable ("Healthy?") in the order in which it arrived. For each piece of evidence, it provides both the weight of evidence (WOE) and the probability of the target hypothesis after observing the evidence. The control on the top of the form allows the analyst to set the scaling for the weight of evidence (to match other balance sheets).
Note that the order of the events is significant. This is easy to understand if you think about one fault which generates two different symptoms. The first symptom we see provides strong evidence for the presence of the fault, but the second symptom we see only provide weak evidence, after all, we already suspect that the fault exists. The total evidence is the same, but whichever evidence arrives first will have greater weight. The original Graphical-Belief design included a never implemented feature for re-arranging the order of the observations to study sensitivity to this issue.
Another way we could use the balance sheet is so explore changing and retracting evidence. For that reason, all of the variables have their current value displayed in a pop-up menu. A currently unimplemented feature would allow the analyst to add, change and retract values directly from the balance sheet. Observable variables whose values weren't yet known would appear as potential weights of evidence.
The level of explanation provided in the first three examples involves only first level questions, in particular, "What evidence was most influential in our beliefs about the target probability?" Occasionally, we need to dig deeper and answer questions about how is evidence propagating through the model. For this, the technique of Message Tracing is very effective.
 Continue exploring
explanation using Message Tracing.
 Explanation Return to the beginning of the explanation examples.
 Return to
the main example page.
 Back to overview of Graphical-Belief.
 View a list
of Graphical-Belief in publications and downloadable technical
reports.
 The Graphical-Belief user
interface is implemented in Garnet.
 Get more
information about obtaining Graphical-Belief (and why
it is not generally available).
 get
the home page for Russell Almond , author
of Graphical-Belief.
 Click
here to get to the home page for Insightful (the company that StatSci
has eventually evolved into).