 Parameter Uncertainty Parameter Uncertainty
In many cases we do not know the exact value of a parameter, but can make some good guesses. In these cases we have second order uncertainty uncertainty about the parameters in the model. In many cases, this second order uncertainty is induced by data we have about the parameters. Graphical-Belief allows us to model such uncertainty by attaching laws to parameters (probability distributions over the parameters of a distribution are called laws to distinguish them from the first-order distributions associated with the rules). Using these laws Graphical-Belief can model quite complex phenomena.
The law is controlled by a number of hyperparameters (which in Graphical-Belief are just parameters used by the law object.) For example, the mean and standard deviation are the parameters which control a normal law. The mean is a location parameter which controls where the most likely values of the law lie and the standard deviation is a scale parameter which controls how far from the center the likely values are found. The shape of the distribution is determined by both the type of the distribution (for example the symmetric bell of the normal distribution) and the value of various critical parameters.
Usually there are several possible ways to express the hyperparameters for a given law type. These expressions are related by straightforward formulae. We can thus choose the most natural scale for expressing the hyperparameters of a given law. If we choose a special class of laws known as the conjugate laws we can express the law by pseudo-data. Usually, we choose the data so that the mean of the distribution is where we think the location of the law should be and let the number of effective observations determine the scale of the distribution.
Let us think about the six check valves in the LPCI system. Previously, we modelled their failures during standby with a Poisson process. This means that the data we would get from this process can be expressed has so many failures in so many months of observation on standby. The natural conjugate law for the Poisson process failure rate is the gamma law. For rare events, the gamma law is roughly symmetric on the log scale, that is, the error is plus or minus an order of magnitude. The mean is the number of observed failures divided by the length of the the total observation time.
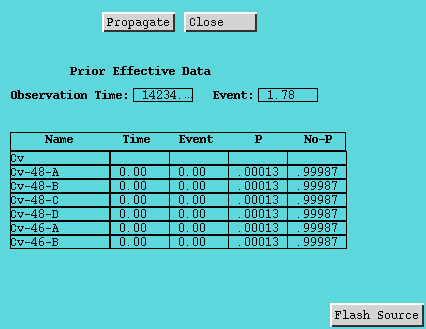
Figure 3. Test Data editor for Check Valve Failure rate.
Graphical-Belief allows the analyst to supply both prior data about the generic class of all check valves and specific test data about the individual check valves. Thus, Figure 3 has both a space for prior data (up at the top) and a space for observations down below. In this case all of the observations times are zero (For the moment we are ignoring the test data in Martz and Waller [1990]).
Note the two fields marked "Observation time" and "Events." This is the prior data for check valves from Martz and Waller [1990]. These are high reliability, well tested components, so the effect prior data is 1.78 failures in 14,234.12 months of testing. (Note that the effective data don't need to be integers, we can use fractional events to achieve the right mean and spread). Assume that we are looking to replace these with valves which are 1/10 as reliable and about which we are less familiar. We assume that our new test data is about the same as observing 1.25 failures in 1000 months of testing. We enter these figures and propagate the results. Figure 4 shows the result, a slight increase in the failure probability from 0.4e-5 to 1.0e-5. (We have backed out the change of the standby time.)
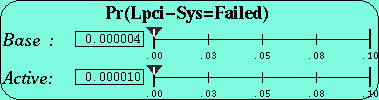
Figure 4. Probe showing effect of getting check valves which are 1/10
as reliable.
 Data about Parameters. Continue with this
example and incorporate data about the parameters.
Data about Parameters. Continue with this
example and incorporate data about the parameters.
 Return to
the main example page.
Return to
the main example page.
Back to overview of Graphical-Belief.
 View a list
of Graphical-Belief in publications and downloadable technical
reports.
View a list
of Graphical-Belief in publications and downloadable technical
reports.
 The Graphical-Belief user
interface is implemented in Garnet.
The Graphical-Belief user
interface is implemented in Garnet.
 Get more
information about obtaining Graphical-Belief (and why
it is not generally available).
Get more
information about obtaining Graphical-Belief (and why
it is not generally available).
 get
the home page for Russell Almond , author
of Graphical-Belief.
get
the home page for Russell Almond , author
of Graphical-Belief.
![]() Click
here to get to the home page for Insightful (the company that StatSci
has eventually evolved into).
Click
here to get to the home page for Insightful (the company that StatSci
has eventually evolved into).